« Back to Publications list
ChronoTwigger: A Visual Analytics Tool for Understanding Source and Test Co-Evolution
Download Publication File
Abstract
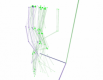
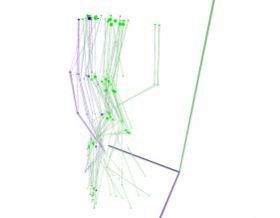
Applying visual analytics to large software systems can help users comprehend the wealth of information produced by source repository mining. One concept of interest is the co-evolution of test code with source code, or how source and test files develop together over time. For example, understanding how the testing pace compares to the development pace can help test managers gauge the effectiveness of their testing strategy. A useful concept that has yet to be effectively incorporated into a co-evolution visualization is co-change. Co-change is a quantity that identifies correlations between software artifacts, and we propose using this to organize our visualization in order to enrich the analysis of co-evolution. In this paper, we create, implement, and study an interactive visual analytics tool that displays source and test file changes over time (co-evolution) while grouping files that change together (co-change). Our new technique improves the analyst’s ability to infer information about the software development process and its relationship to testing. We discuss the development of our system and the results of a small pilot study with three participants. Our findings show that our visualization can lead to inferences that are not easily made using other techniques alone.
Video
Download the ChronoTwigger: A Visual Analytics Tool for Understanding Source and Test Co-Evolution video file.
Citation
Barrett Ens, Daniel Rea, Roiy Shpaner, Hadi Hemmati, James E. Young, Pourang Irani. 2014. ChronoTwigger: A Visual Analytics Tool for Understanding Source and Test Co-Evolution. In Proceedings of the 2nd IEEE Working Conference on Software Visualization (VISSOFT 2014). Victoria, Canada. IEEE, 117-126.
Authors

Barrett Ens
Alumni
Daniel J. Rea
Assistant Professor
Roiy Shpaner
Alumni
James E.Young
Professor
Pourang Irani
ProfessorCanada Research Chair
at University of British Columbia Okanagan Campus
As well as: Hadi Hemmati